The power of Journal Analytics in child therapy


Published by Madhushree
a year ago
With the world becoming more tech-savvy and digital, therapy centers can now utilize more advanced and innovative techniques to deliver therapy. Using a journal as we understand it is a powerful tool that allows therapists and caregivers to identify patterns and reflect on issues that are important to their clients. The benefits of documenting your child's therapy journey are numerous. You can refer to our blog post to learn why and how journaling your child's day-to-day life becomes essential.
Being able to gain insight into a child's life outside of the therapy center can be challenging. An in-depth manual analysis can take a long time and be unstructured. Taking the time to jot down every important detail or situation can prove challenging for parents or caregivers, and it can also be time-consuming. Here is where Journal Analytics can come in handy and be of utmost use to therapists and parents. This blog post will discuss how journal analytics can help therapy centers provide better and more advanced services by catering to the various needs of therapy centers.
Key Advantages
The first and most important benefit of having journal analytics is the ability to visually view information. The advantage of having a visual representation of data can provide a clean and clear picture of where the child stands. Visualizing the data helps therapists to communicate complex information in a creative, accessible, and intuitive way, benefiting parents to comprehend easily. Presenting information in a visually appealing manner leads to more informed decisions and better insight into their growth and development.
Using this visual information, it can become easier for therapists to identify patterns and themes of the child. For example, you may notice a meltdown every time the child informs the child it is time to go to the park. Therapists can quickly point out and investigate to understand the triggers and come up with appropriate interventions.
Continuing to document such information can showcase the spikes and dips in the child’s growth and development. Assessing and analyzing information over long periods of time and across multiple areas brings light to the development and progression of each child. It helps therapists examine and study what needs to be navigated on the right path, and provide any additional support that may be needed.
Refer to the image below to understand the various types of representation of data to identify patterns and view the changes.
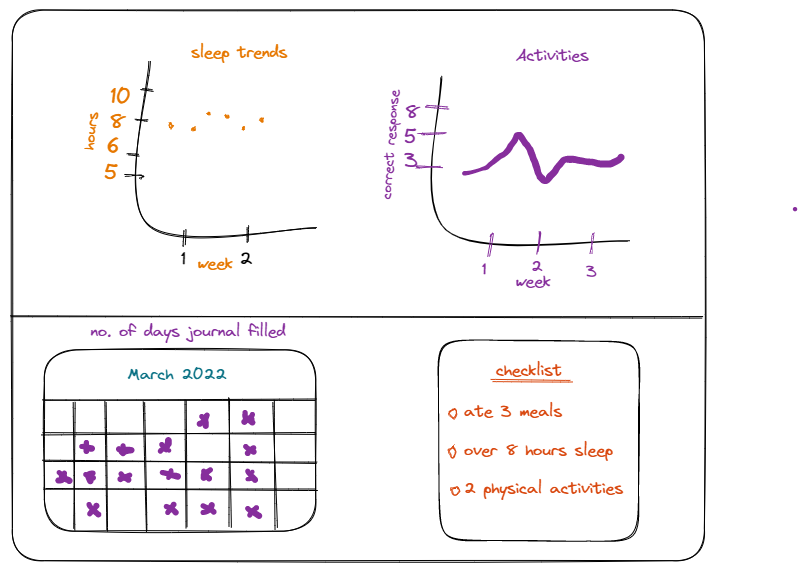
We understand that it's not always easy to have conversations with parents and convey information in a clear and concise manner. Journal analytics can make this easier for therapists by asking the right questions and supporting them with follow-up questions to get a detailed understanding through pre-designed templates that gather qualitative data that can be visually represented to the parents for better understanding. Using categories can make it simple for parents to understand and adding a bit of color and creativity to the visual representations can keep them engaged and interested in analyzing the development of their child
The advancement of technology has made it possible to automate journal response interpretation and categorize them in the desired manner. Using various algorithms, the accuracy and dependency of results have increased, making it significantly easier for therapists to provide better services and improve the quality of the therapy delivery process. While journal analytics can provide many benefits, manual analysis of journals can be a time-consuming and subjective process. Therapists may need to spend hours reading through each entry and manually categorizing them based on themes or emotions. This can be difficult to do consistently and accurately, especially when dealing with a large number of journal entries.
Choosing the right visualization methods
Creating visual representations of data is very crucial. It's extremely important to provide accurate information to parents and caregivers, and for the development of each child. One must use the right kind of algorithms, have a structure of what they want to represent, and see what kind of graphs would represent each area. For example, a scatterplot may be appropriate for tracking changes over time, while a bar chart may be better suited for comparing different emotions or feelings. There are many aspects to keep in mind while designing your template. Clearly articulate what each graph represents, and what is on the x-axis and y-axis.
Each graph must have the following main qualities:
- Accurate data representation
- Effective communication
- Ease of interpretation
It's important to select the appropriate graph or visualization based on the data being analyzed. With the right choice of graphs and visualizations, therapists can gain valuable insights into their young child's developmental states and make informed decisions about their care.
Here is how Kidaura’s Journal Analytics benefits therapy centers and caregivers
- A pre-designed template consisting of important questions aiming to gather in-depth information of each area focus
- Accurate visual representation of data
- Gathers information segregating it into areas such as behaviors, meltdowns, sleep and food patterns, and others.
- Unique insights on a monthly and weekly basis
- Easy for caregivers and therapists to interpret.
- View various trends and patterns - behavior, meltdown, and sleep.
- Colourful, Creative, and Attractive.

Kidaura aims at bettering the therapeutic experience for both caregivers and children. Our journal feature aids you in easing the therapist's job of manually documenting information and also encourages parents to be involved in the child’s life.
Why wait? Go check out Kidaura’s Journal and Analytics feature and Sign Up now!
Share via
Follow Us


© 2019-2024 Kidaura, All Rights Reserved